
Technical Analysis
Reading the gamma flip
On this page
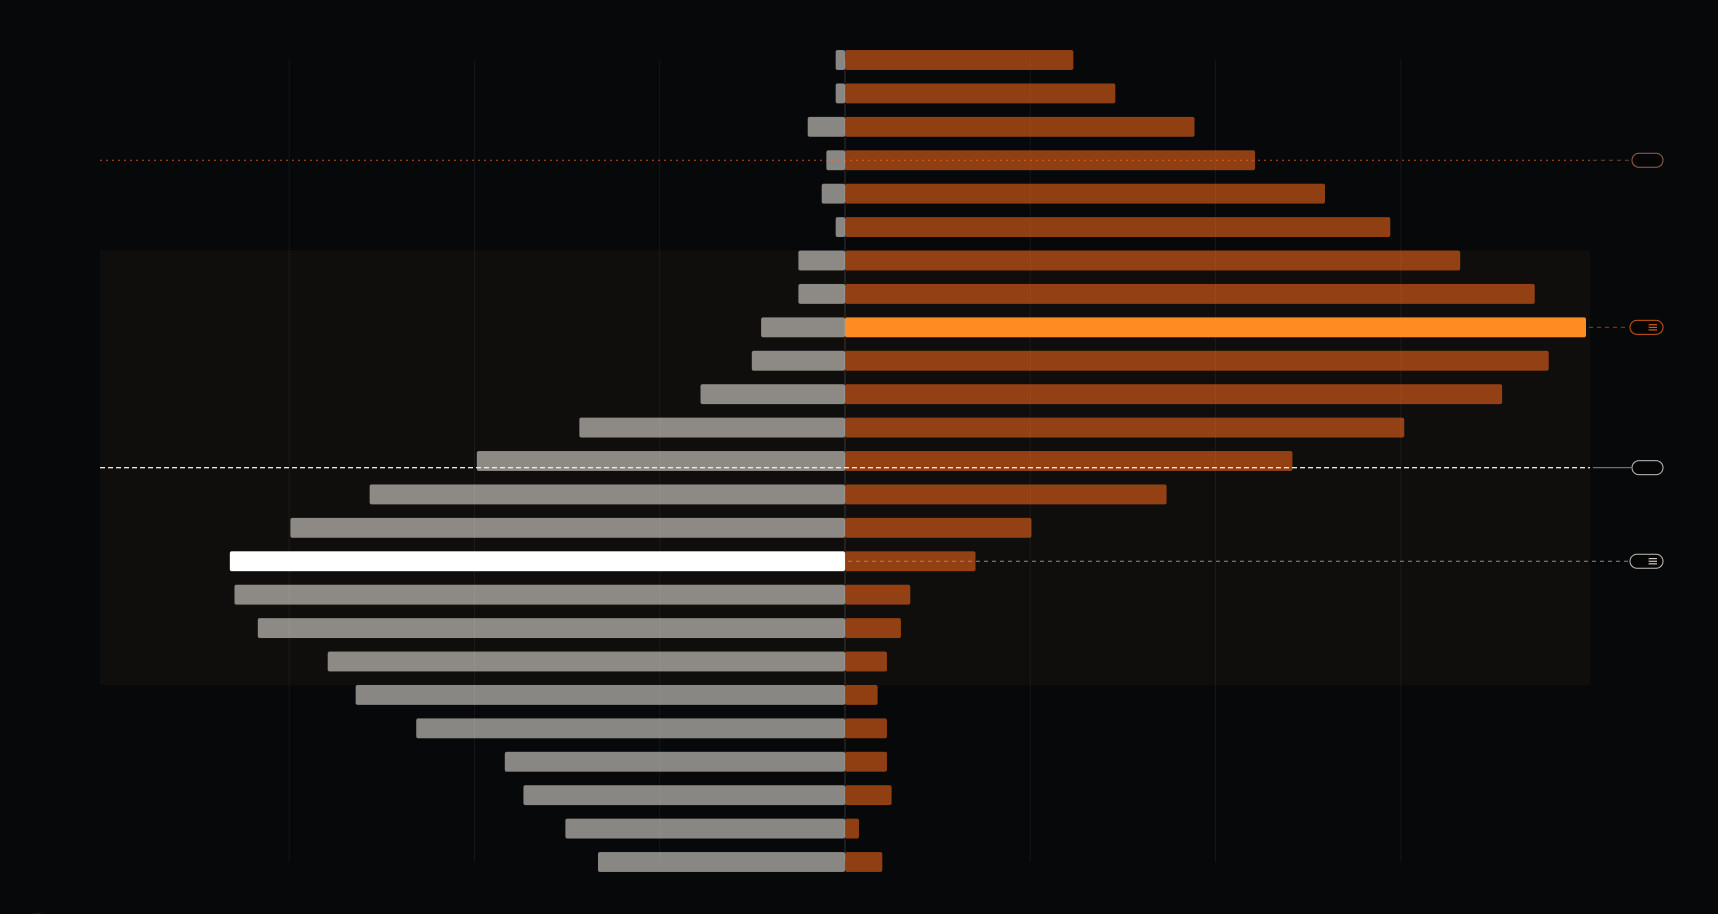
A gamma flip looks deceptively precise on a chart: one number, often drawn as a clean horizontal line. It marks an estimated transition in the profile at that moment. The displayed level can change as market conditions change.
Imagine a profile whose total is positive at 5,200 and negative at 5,190. The modeled flip lies between them. That says nothing about a buy or sell order waiting at the exact crossing. It says the model’s aggregate sign changes there.
Why a crossing can matter
For a dealer actually long gamma and delta hedging, a rise in price can lead to selling some underlying while a fall can lead to buying. Short-gamma hedging can lean with a move. If enough participants face similar exposures, those flows may influence how far a move travels. Cboe has published research on the size and limits of this channel in SPX 0DTE trading; the impact depends on net positions, not headline option volume.
A public-chain model cannot tell you whether dealers really have the assumed position. It also misses hedges in related products and decisions made away from a simple continuous hedge. The flip is therefore a hypothesis about market structure, not a switch that forces the tape to change.
A crossing is not the same as acceptance
Price can dip below a flip and return above it within minutes. A trader who labels every tick below the line a new regime will repeatedly change plans in a noisy market. Watch whether price spends time on the other side, whether pullbacks hold there, and whether realized movement changes. Those observations are more informative than a single print.
The opposite problem is anchoring to yesterday’s flip. Spot, volatility, time to expiry, and the available chain all change. A level drawn before a major event may be stale after the event reprices options. On same-day expiry, the profile can change substantially as the clock runs down even with modest movement in spot.
What to check before using it
Start with the expiry window. Check how far spot is from the flip and whether a large wall sits nearby. Then look at the option market: are implied volatilities stable, or is a scheduled catalyst about to reprice them? Finally, look at actual trade and liquidity conditions around the crossing. If the level changes but price behavior does not, keep the conclusion small.
Suppose price breaks below an estimated flip while a major economic release is due in five minutes. The release can overwhelm any ordinary hedging response. A sensible plan defines the observation that would confirm a change, the observation that would reject it, and the risk limit that applies either way. The flip contributes context; it does not supply those decisions for you.
Reading the line honestly
The flip is best treated as an area of increased attention. It helps ask whether the market is becoming more prone to fade moves or extend them under the model’s assumptions. When two tools disagree on its location, that uncertainty is part of the information. Use a range, check the method, and let the current market earn your confidence.
Sources and further reading
Research and platform documentation used to check this article.