
Technical Analysis
How to read a dealer gamma exposure chart
On this page
A gamma chart can look like a map of orders waiting in the market. That is an easy mistake to make. Its bars are estimates built from option contracts, pricing inputs, and assumptions about who holds the risk. No public option chain opens a dealer’s books.
The useful question is narrower: where would the option book be most sensitive to a change in the underlying price, if the model’s assumptions were roughly right? That question is worth asking. It gives context for a session without pretending to know the next trade.
Start with delta
Delta estimates how much an option’s value changes for a small move in the underlying, holding other inputs steady. A call with a delta near 0.50 behaves, locally, like exposure to about fifty shares per standard 100-share contract. A trader hedging that exposure might take the opposite position in shares or a related instrument. Real hedges are often more complicated, but this simple picture explains why options can create trading in the underlying.
Gamma measures how fast delta changes when the underlying moves. If a position has high gamma, yesterday’s or even this morning’s hedge can become a poor fit after a relatively small move. The closer an option is to expiry and to the money, the more sharply its sensitivity can change. The exact value also depends on implied volatility and the pricing model.
What a GEX profile shows
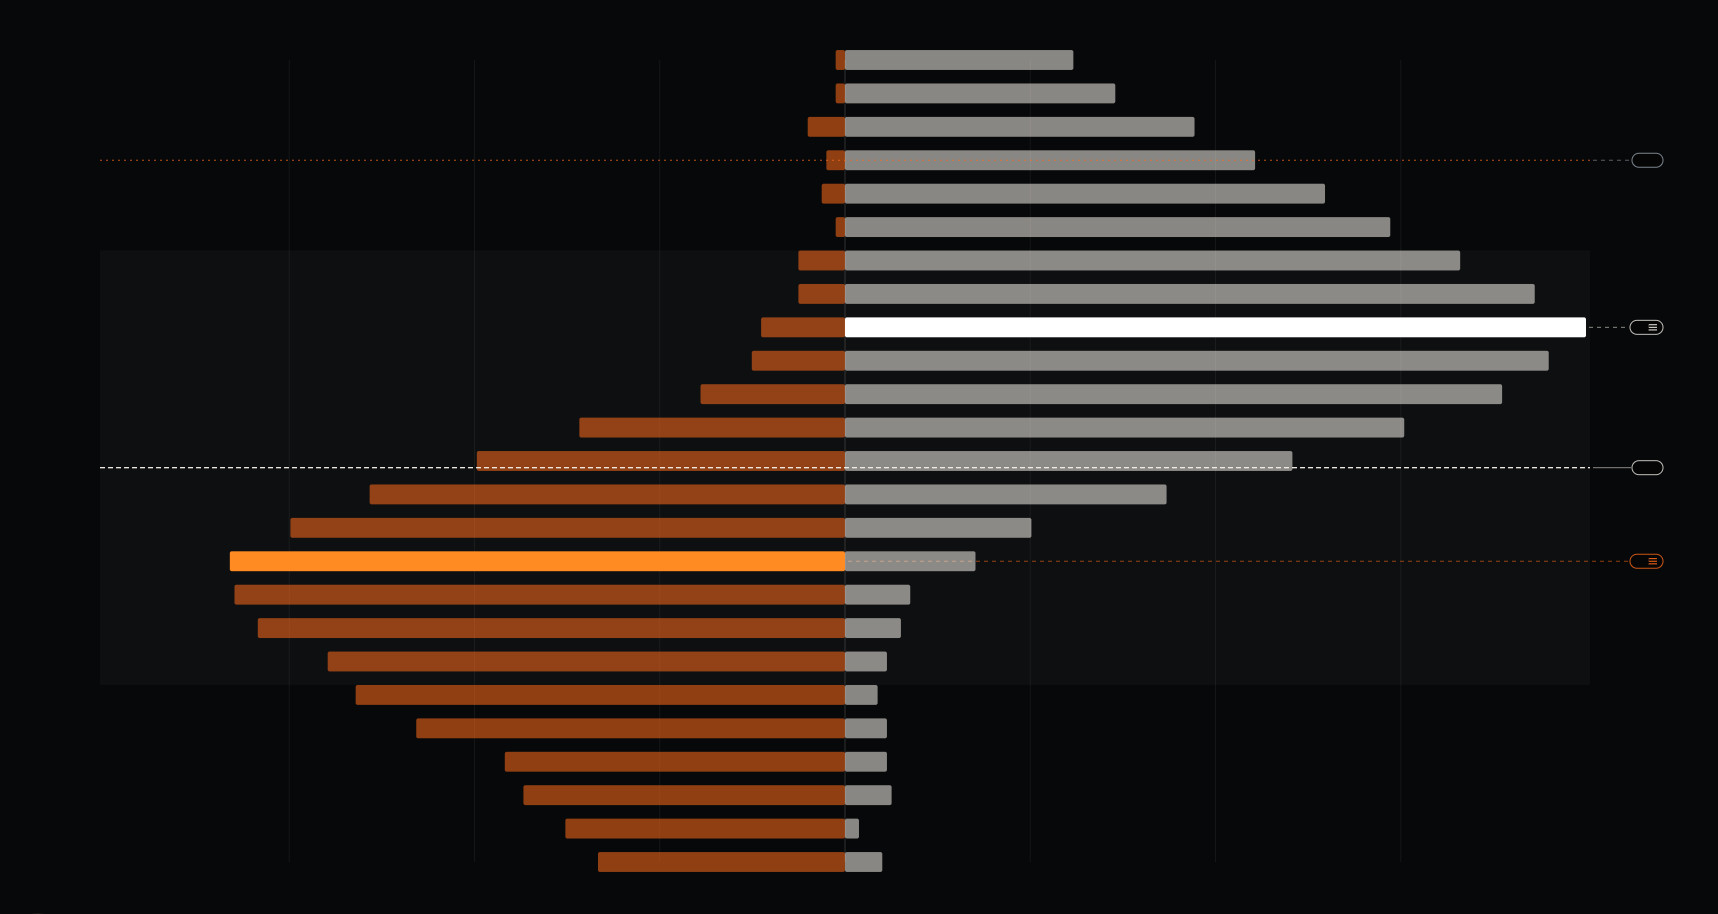
The bars highlight areas where the modeled option exposure is concentrated. Read the axis and expiry window before comparing two screens: a chart focused on today’s contracts can tell a different story from one covering a longer period.
Open interest tells us how many contracts remained open after clearing. It does not tell us whether a customer or dealer is long, whether the position was hedged elsewhere, or whether today’s trading opened or closed it. A signed exposure chart is an estimate, not a view into private dealer books.
This distinction matters most on busy days. Prices and option sensitivities can change quickly, while published position counts follow a different schedule. A chart moving in real time should not be read as a live record of every participant’s position.
Why the sign attracts attention
Consider a dealer that is genuinely long gamma and keeps its delta hedge near flat. As price rises, it may sell some underlying; as price falls, it may buy. That response leans against the move. A short-gamma dealer doing the same kind of hedging may need to buy into a rise and sell into a fall. That response can add to the move. These are possible flows, not a timetable or a guaranteed market effect.
The actual net position can be smaller than a single-chain estimate suggests. Customer buying and selling can offset. Risk can be netted across expiries, ETFs, futures, and other positions. A firm may hedge at intervals rather than on every tick. Cboe’s research on SPX 0DTE emphasizes this distinction between large gross trading volume and the net risk that might require hedging.
Walls and flips, in plain language
A wall marks a strike where a model finds a large concentration. Providers can define walls differently. The gamma flip marks an estimated transition in the profile; it need not sit at the strike with the largest bar. Neither label identifies an order waiting in the market.
Suppose price opens below a large call concentration and reaches that strike after a strong rally. The level is a place to observe. If buying continues and price holds above it, a wall has offered little resistance in that session. If the market repeatedly trades into it and stalls, the behavior deserves attention. Neither outcome can be known from the bar alone.
Walk through a hypothetical GEX screen
Suppose an index is at 5,200. Your screen shows a modeled call wall at 5,230, a put wall at 5,170, and a gamma flip at 5,195. First, read the timestamp and included expiries. If the chart uses only today’s contracts, it is answering a different question from a longer-term profile. Check the chart labels, too, so you know what the bars represent.
The flip sits five points below spot in this example. That does not make 5,195 a stop or tell you to buy at 5,200. It says the modeled signed total crosses zero around that price. If the index trades down through 5,195 and stays there, compare the resulting price movement with the idea of a less damped regime. If it crosses and immediately returns, you have learned how little that single print said.
The call wall is 30 points away. You can mark it for a later test without assuming the market will reach it. If price does arrive, watch whether offers absorb buying or price accepts above the strike. By then spot, implied volatility, and time to expiry may have moved enough that the morning profile needs a refresh. These example numbers are invented to show the reading sequence; they describe no real session.
Where a model can mislead
A different expiry window can draw a different wall. Near expiry, a small price move or a few hours of decay can redraw the profile. Providers may also label exposures differently. Check the labels before assigning a story to a color.
A GEX model also says little about a surprise economic release, a large non-option seller, or liquidity disappearing from the order book. Those forces can dominate a modeled hedging effect. The clearest use is to prepare a few scenarios, then check whether the live market behaves as the scenario suggests.
A practical way to read the chart
Before the session, mark the biggest nearby concentrations, the estimated flip, the expiry window, and the timestamp. When price approaches one of those areas, check price response, traded volume, available liquidity, and the day’s catalysts. If the tape disagrees with the map, revise the map in your head. A risk limit should come from the trade plan and the instrument, never from the fact that a colored line exists.
Gamma exposure is most useful as a disciplined question generator. It shows where an assumed option book is sensitive and how that sensitivity might change with price. The market still has to show you what is happening.
Sources and further reading
Research and platform documentation used to check this article.