
Absorption vs exhaustion at a level
A stalled move can reflect fading aggression or heavy opposite-side trade. Learn what each looks like.
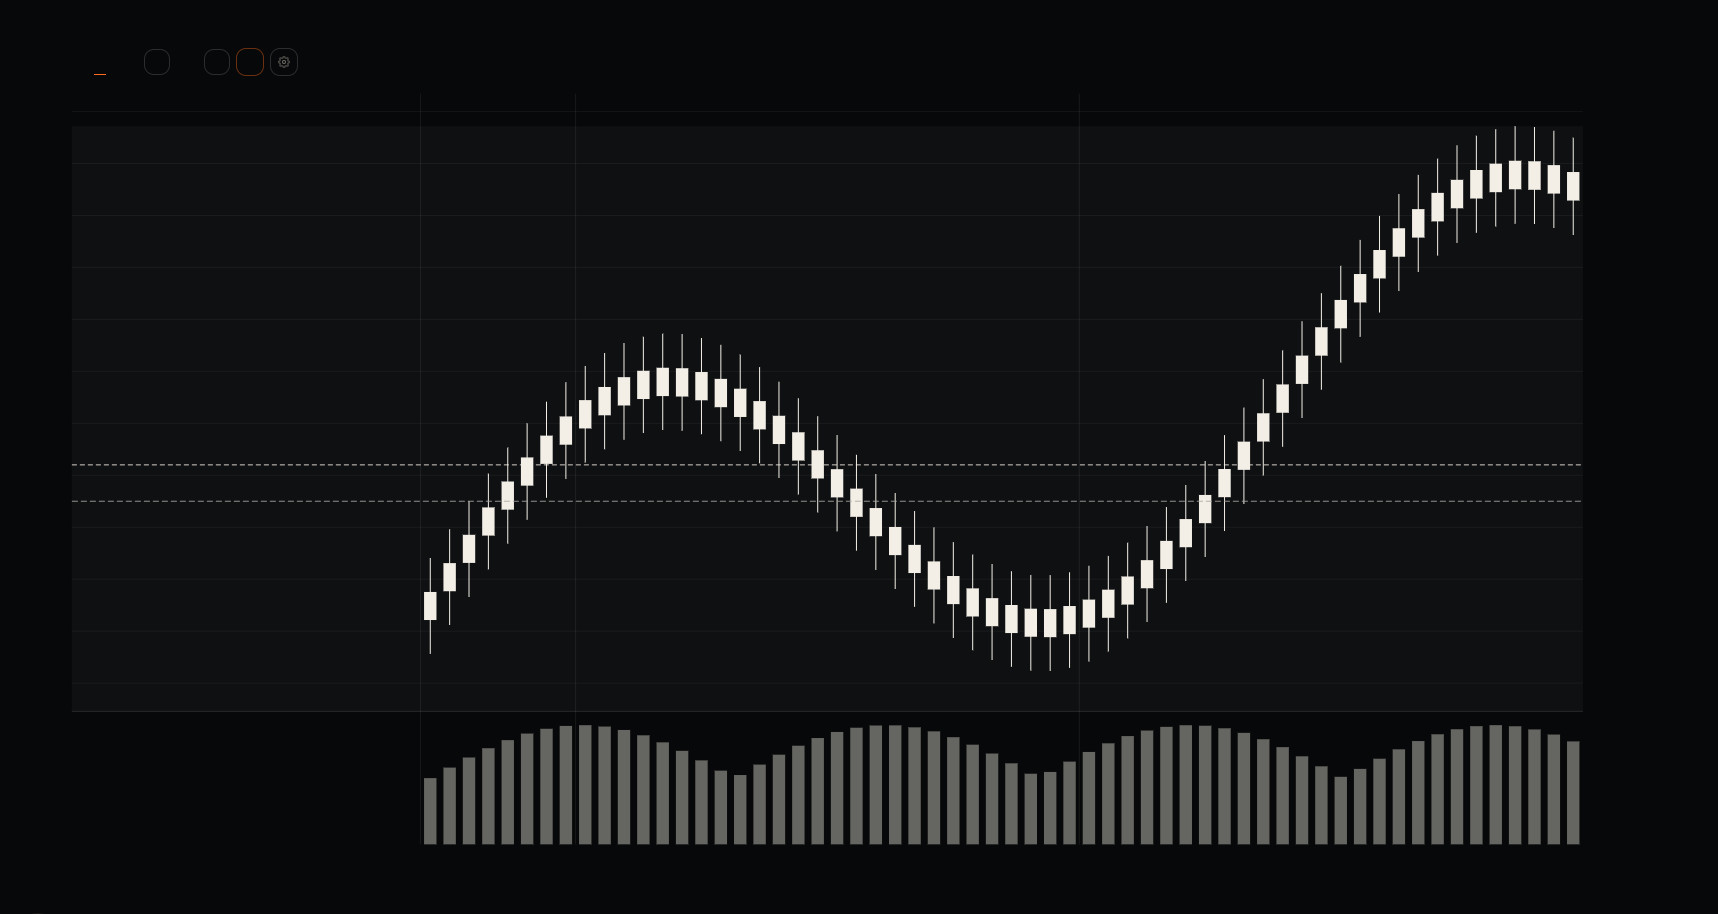
Price can stop falling for two very different reasons. Sellers may have slowed down, or buyers may be taking everything sellers offer. Traders call the first pattern exhaustion and the second absorption. Both are interpretations of the tape, so neither can be diagnosed from one quiet candle.
Exhaustion: activity fades at the edge
Imagine a decline that makes one last low on noticeably less traded volume. Fewer sellers are hitting bids and the footprint thins near the extreme. That is compatible with exhaustion: the push ran short of immediate aggression. It does not prove buyers have taken control. If new sell orders arrive, the decline can resume.
The distinction matters for the next test. A small bounce after quiet selling may return to the low because no substantial buyer has yet shown a willingness to absorb fresh supply. Watch whether the next push attracts more volume or dries up again.
Absorption: activity stays heavy while price stalls
Now imagine large seller-initiated volume repeatedly trading near the same low, while price barely moves lower. Bids are being filled, replaced, or supplemented. That is consistent with absorption. You can observe the traded volume and stalled price; you cannot see every account behind the bids or know how much capacity remains.
A strong looking absorption pattern can break. The buyer may finish an order, cancel the remainder, or step away when conditions change. If price accepts below the defended area, the interpretation that buyers could hold it has been challenged. This is why an apparent absorber needs an invalidation level before it becomes part of a plan.
Look beyond delta alone
Footprint delta helps separate seller pressure from a quiet stall, but the order book and price response matter too. Did the bid keep reappearing after trades? Did the spread widen? Was the stop in progress caused by an exchange pause or a news event? In a thin contract, a small number of trades can make either pattern look more decisive than it is.
It also helps to compare several bars. One bar with heavy negative delta and no new low might be random two-sided trade. A repeated test at the same price, each with substantial selling but little progress, gives a more specific observation.
When a modeled level is nearby
A put wall or value-area edge can tell you where to focus attention. Absorption at that price adds current trade evidence; exhaustion adds a different kind of evidence. Neither establishes that the modeled level caused the stall. If price trades through the area, the observed break deserves more weight than the story attached to the line.
Sources and further reading
The research this guide leans on. Citations rather than links, so they stay verifiable after journal URLs move.
- Kyle, A.S. (1985). Continuous Auctions and Insider Trading. Econometrica 53(6).
- Cont, R., Kukanov, A. and Stoikov, S. (2014). The Price Impact of Order Book Events. Journal of Financial Econometrics 12(1).
- Harris, L. (2003). Trading and Exchanges: Market Microstructure for Practitioners. Oxford University Press.