
Cumulative delta and divergence
Compare cumulative volume delta with price and investigate what a divergence actually shows.
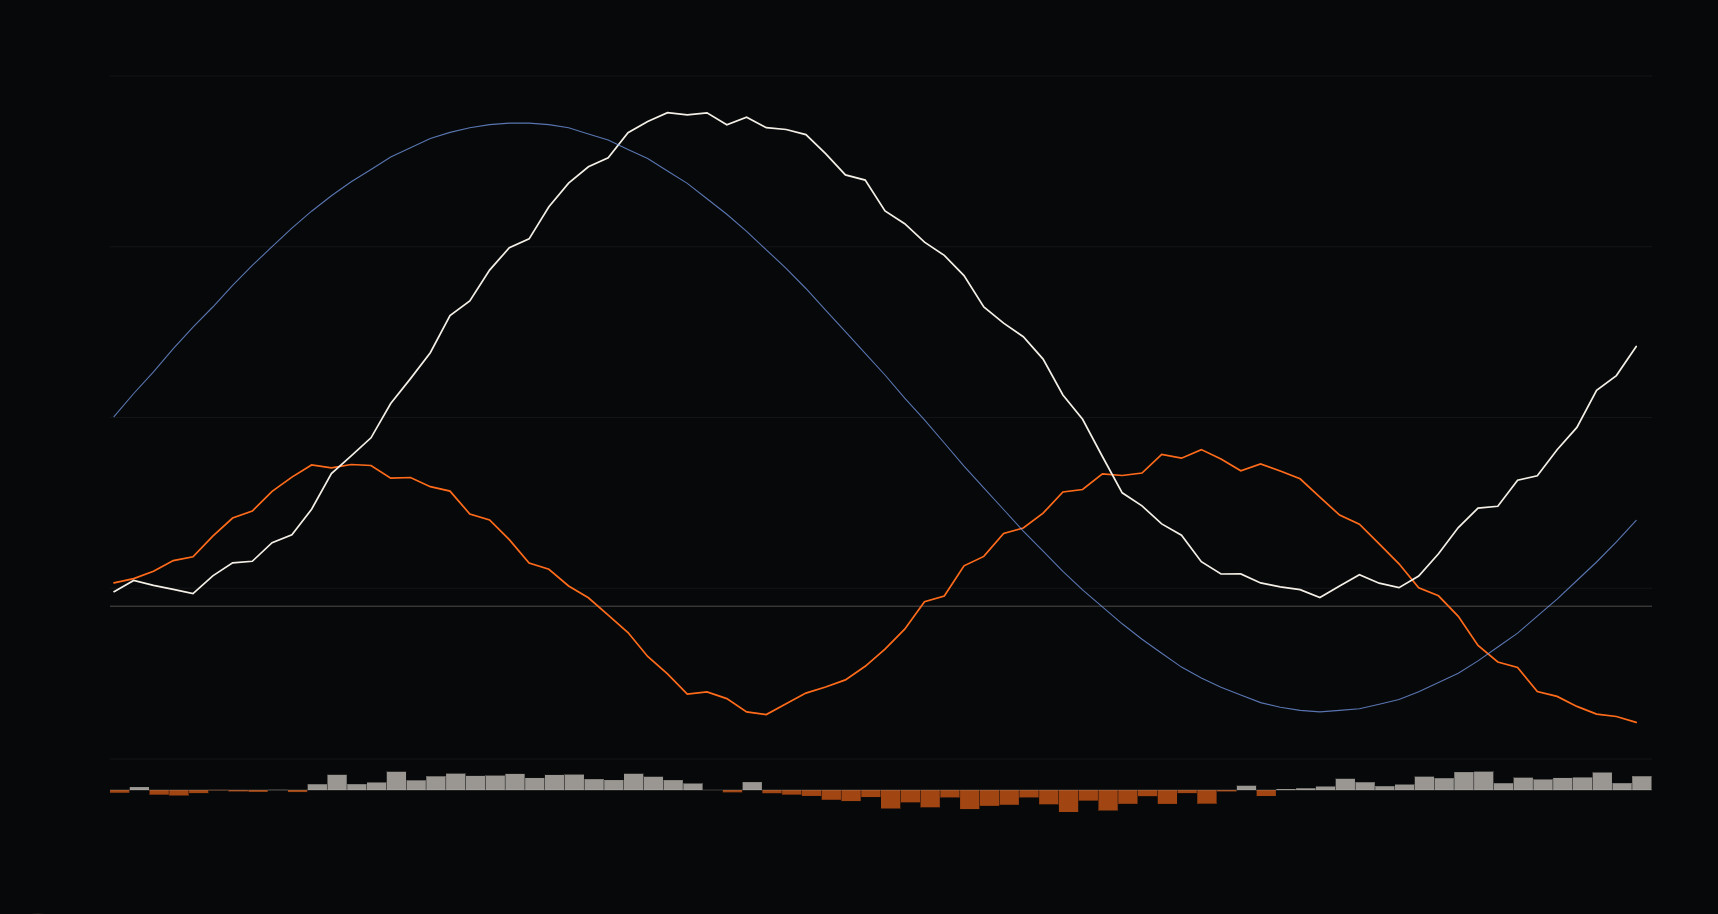
Cumulative volume delta, often shortened to CVD, keeps a running total of buyer-initiated volume minus seller-initiated volume. It is a way to compare the pressure in executed trades with the price path over the same period. It cannot see every hidden motive behind those trades.
The starting point matters. Some charts reset CVD at the cash open; others carry it across a longer session. Compare a morning CVD line with morning price if that is the window you mean to study. A line built on a different session boundary can tell a different story.
When price falls but CVD holds
Suppose price makes a fresh low while CVD makes a higher low. Net buyer-initiated minus seller-initiated volume was less negative over the compared swings. That can happen because fewer sellers crossed the spread, more buyers did, or both. It may also reflect thinner liquidity: price can fall farther on less volume when bids disappear. The divergence alone does not distinguish those possibilities.
Watch the next attempt. If price recovers the prior low and buyers continue to lift offers, the divergence gains context. If price keeps falling through thin bids, the market has shown you that less aggressive volume was enough to move it.
When CVD falls but price holds
Now imagine CVD setting a new low while price refuses to break its previous low. Seller-initiated trades are reaching the market, and enough buying interest is meeting them to prevent immediate progress. Traders often call this absorption. The buyer could be one large participant or many smaller ones; the footprint cannot identify them.
Absorption can fail. Once the available bids are consumed or withdrawn, price may break quickly. Treat a defended low as a price to watch and define what would invalidate the idea that it is holding. Do not promote a CVD divergence into a guarantee.
Data quality changes the line
Trade classification can differ across feeds and methods, especially for trades that occur between quoted bid and offer or when quotes and prints arrive out of sequence. A large trade can move CVD sharply without creating a durable change in price. In fragmented markets, a single venue's feed may omit part of the picture.
The line is most useful when its construction is consistent and you compare like periods. Look at the direction and timing of change, then inspect the actual price response. A precise CVD value matters less than the sequence that produced it.
A practical pairing with levels
Mark a price area before the test, whether it comes from a prior auction, visible liquidity, or a modeled options concentration. When price arrives, compare CVD and price over several bars. Did aggressive volume get price through the area, or did it stop making progress? That question keeps the indicator attached to an observable event.
Sources and further reading
The research this guide leans on. Citations rather than links, so they stay verifiable after journal URLs move.
- Lee, C.M.C. and Ready, M.J. (1991). Inferring Trade Direction from Intraday Data. Journal of Finance 46(2).
- Chordia, T., Roll, R. and Subrahmanyam, A. (2002). Order imbalance, liquidity, and market returns. Journal of Financial Economics 65(1).
- Easley, D., Lopez de Prado, M. and O’Hara, M. (2012). Flow Toxicity and Liquidity in a High-Frequency World. Review of Financial Studies 25(5).