
What gamma exposure actually is
How to read a gamma exposure profile, and what it cannot tell you about dealer positions.
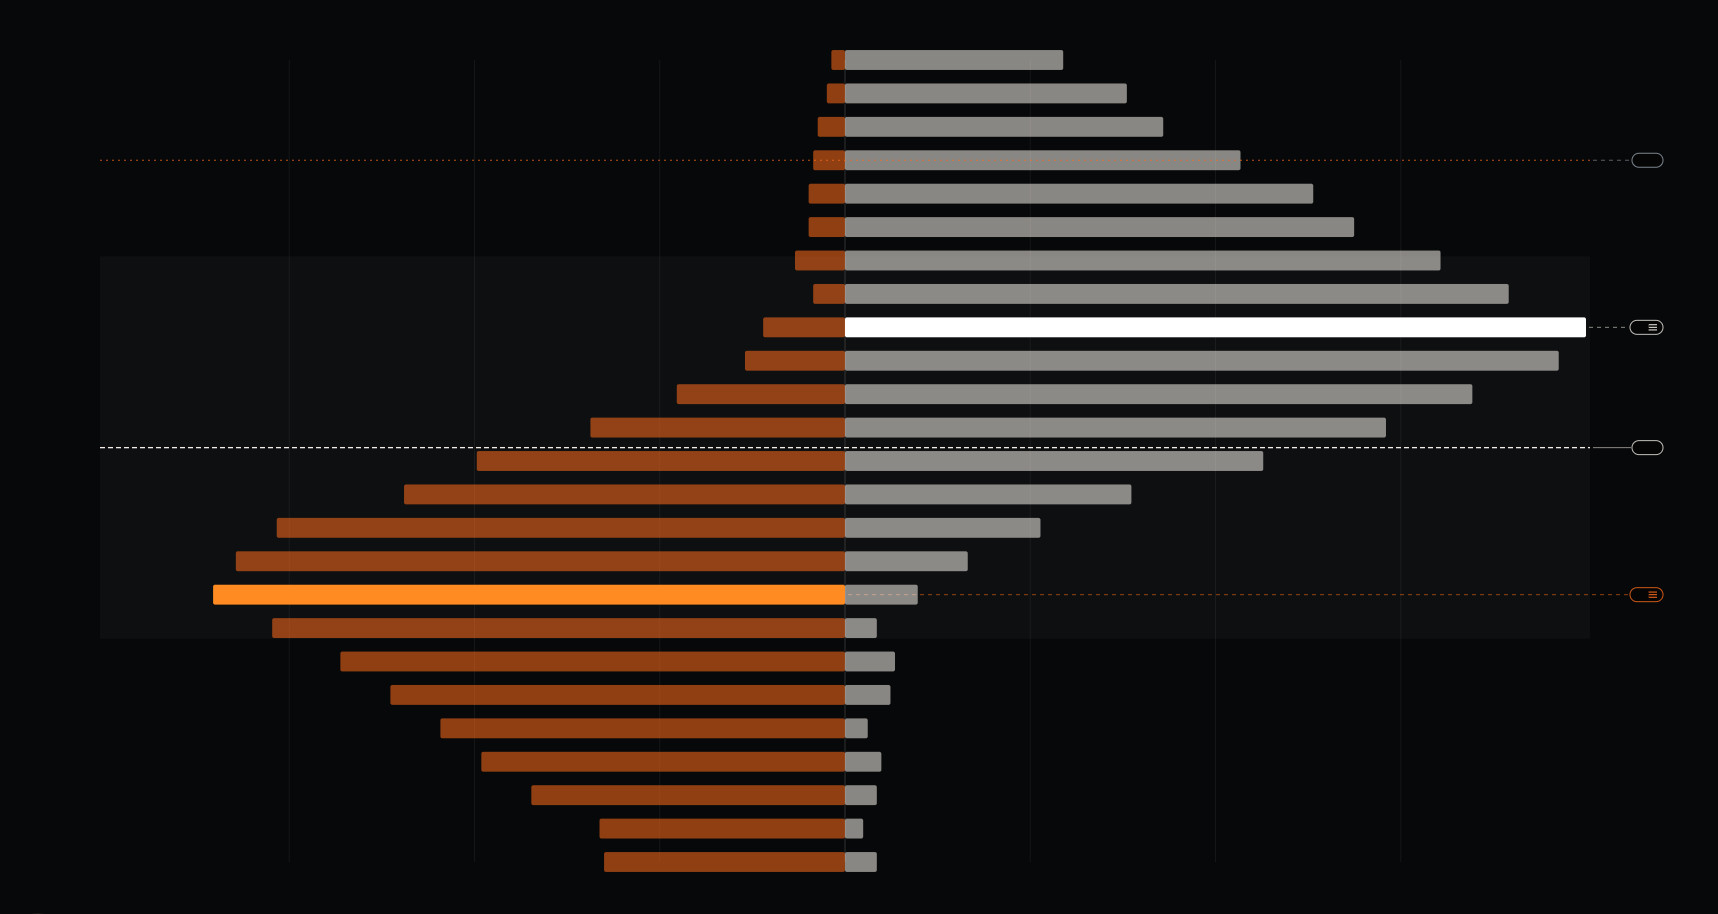
A gamma exposure chart asks a useful question: where would the option book become most sensitive if the underlying moved? Its answer is a model, assembled from an option chain and a set of assumptions. You can learn a lot from the shape without pretending the chart shows a dealer's actual inventory.
Start with a simple contract. One standard equity call usually represents 100 shares. If its delta is 0.50, the option initially behaves like exposure to about 50 shares for a small price move. A participant trying to offset that delta might trade shares or a related instrument. The hedge becomes less accurate when delta changes.
Delta changes; gamma measures the change
Gamma estimates how much delta changes as the underlying moves. A call with delta 0.50 might move to 0.55 after a small rise. That change matters to someone who wants to keep a hedge close to flat. Gamma is often most concentrated near the strike as expiry approaches, though its size depends on volatility and the precise contract.
A dealer who is genuinely long gamma and regularly delta hedges may sell some underlying after a rise and buy after a fall. A short-gamma position can create the opposite tendency. That possible feedback explains why traders study GEX. The size of the effect depends on the net positions held, how they are hedged, and the liquidity available when hedges are adjusted.
Reading the profile
The bars show where modeled exposure is concentrated. Read the unit and expiry window before comparing two screens. A chart focused on today's contracts may look very different from a longer-term view.
Open interest is a count of contracts left open after clearing. It does not say who bought them, who sold them, or whether a dealer is the counterparty. A profile offers a view of possible sensitivity without opening anyone's private book.
The distinction matters on active days. Market prices and option sensitivities can change quickly, while official open interest follows the clearing schedule. A changing chart is not a live record of every position in the market.
What to watch on the screen
Find the largest nearby concentrations, the estimated gamma flip, and the expiries included. The flip is the modeled underlying price where signed total exposure crosses zero. It can move when the inputs move. A wall is a concentration at a strike, not an order waiting to stop price.
Now imagine price approaching a large call concentration. One session may stall there; another may trade straight through after a news release. The chart told you where sensitivity was concentrated under its assumptions. Price response, volume, liquidity, and the catalyst tell you what happened when the market arrived.
Sources and further reading
The research this guide leans on. Citations rather than links, so they stay verifiable after journal URLs move.
- Barbon, A. and Buraschi, A. (2020). Gamma Fragility. Working paper.
- Baltussen, G., Da, Z., Lammers, S. and Martens, M. (2021). Hedging demand and market intraday momentum. Journal of Financial Economics 142(1).
- Garleanu, N., Pedersen, L.H. and Poteshman, A.M. (2009). Demand-Based Option Pricing. Review of Financial Studies 22(10).
- SqueezeMetrics (2017). Gamma Exposure (GEX). Practitioner white paper.
- Cboe Global Markets (2025). 0DTEs Decoded: Positioning, Trends, and Market Impact.