
Reading positive and negative gamma regimes
How long- and short-gamma hedging could affect a session, with checks against the live market.
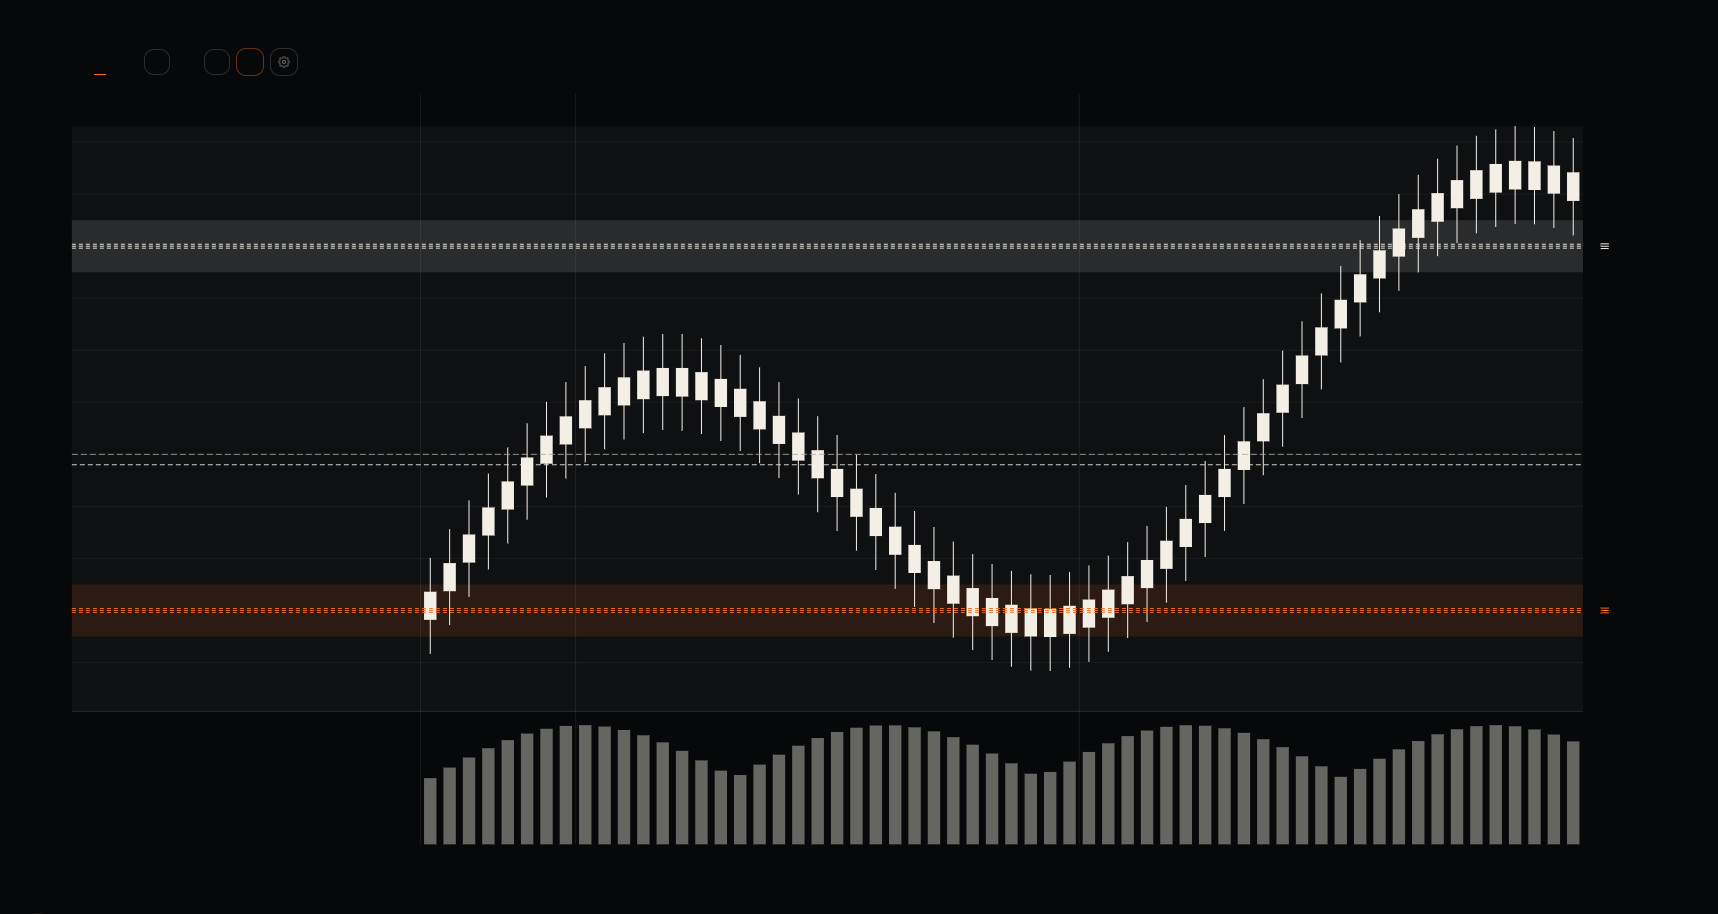
Some sessions rotate around a familiar range. Others keep extending after every apparent breakout. Options hedging may contribute to those different textures, but a positive or negative GEX reading by itself cannot diagnose the whole day. It is one hypothesis to compare with the market you can actually see.
What the sign describes
If a dealer is long gamma and wants to keep its delta hedge near flat, a rise in the underlying may lead it to sell; a fall may lead it to buy. That response can counter part of the move. A dealer short gamma may need to buy into a rise and sell into a fall, adding to movement. These mechanics explain the familiar shorthand about positive gamma and negative gamma.
The catch is the word if. Public open interest does not reveal dealers' net positions. Customer trades can offset, a firm can hedge through other instruments, and participants do not all rebalance on the same schedule. A modeled reading offers a scenario to test, not a census of dealer books.
A positive reading on a moving day
Suppose a profile estimates positive net gamma and the morning keeps returning to a heavy nearby strike. That is consistent with a dampening-hedge story. It is also consistent with ordinary two-sided trade, a lack of news, or liquidity sitting near that price. You cannot identify the cause from the chart alone.
Now suppose a scheduled announcement hits and price breaks out. A positive model reading does not prohibit a trend. It only suggests one possible flow that might lean against movement. The announcement and the available liquidity may be much larger forces. A plan built on “positive gamma means fade every rally” can fail quickly here.
A negative reading in a quiet range
The reverse mistake is expecting a runaway move whenever modeled net gamma is negative. Short-gamma hedging can amplify a move if dealers hold that risk and need to rebalance. It does not create a catalyst on its own. Price can remain quiet for hours if buying and selling are balanced.
A useful comparison is realized movement against the story. Are breakouts holding beyond recent ranges? Are pullbacks shallow? Does liquidity thin when price accelerates? Those observations can support the amplification scenario. Repeated failed breakouts argue for a smaller role for it today.
When the profile changes sign
A modeled flip may sit near current price. Crossing it can change the sign of the calculation without changing every participant's behavior at once. Check whether price accepts the new area, whether the flip moves as spot and implied volatility change, and whether the expiry mix is changing. Same-day options can make the estimate especially sensitive to the clock.
Keep a simple record after sessions: the model's sign before the open, the actual price range, the catalysts, and what happened at the closest concentration. Over time, that record is more useful than repeating a regime label without checking it.
Sources and further reading
The research this guide leans on. Citations rather than links, so they stay verifiable after journal URLs move.
- Baltussen, G., Da, Z., Lammers, S. and Martens, M. (2021). Hedging demand and market intraday momentum. Journal of Financial Economics 142(1).
- Barbon, A. and Buraschi, A. (2020). Gamma Fragility. Working paper.
- Bollen, N.P.B. and Whaley, R.E. (2004). Does Net Buying Pressure Affect the Shape of Implied Volatility Functions? Journal of Finance 59(2).