
Call walls, put walls and the gamma flip
What call walls, put walls and the gamma flip measure, and how to read a test of those levels.
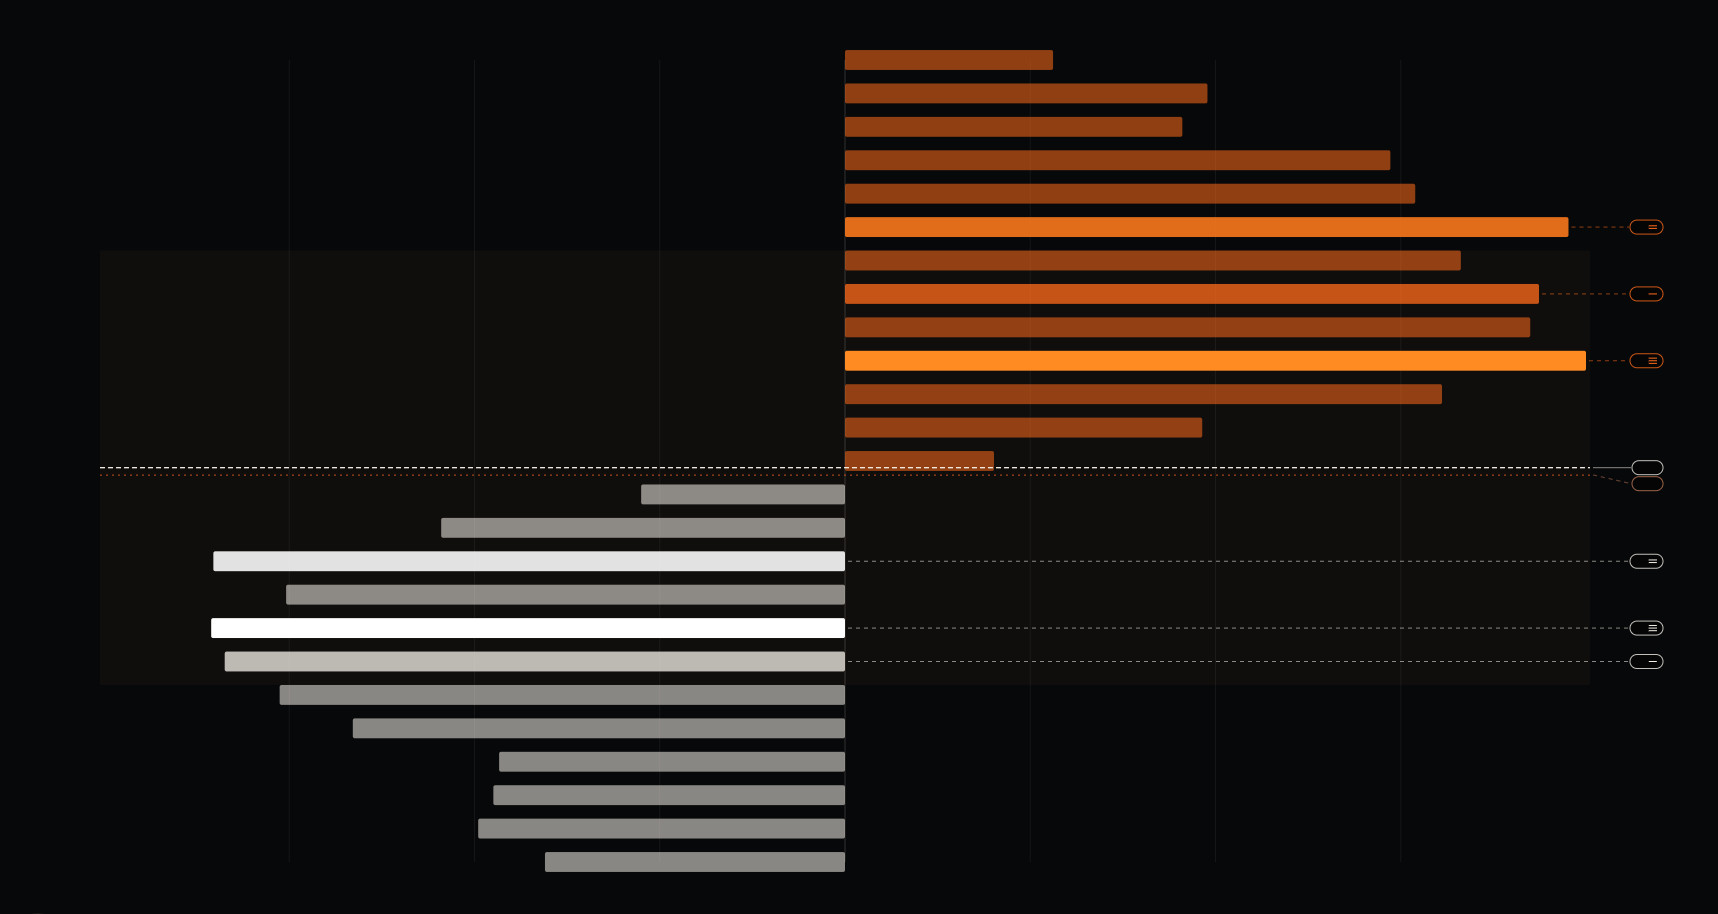
The call wall, put wall, and gamma flip compress a much larger options profile into a few labels. They are handy labels if you know exactly what each one means on the screen you are using. Different providers can calculate them differently, and none of the three is a standing order in the market.
Start with the underlying and the expiry window. A wall from all listed expiries can be different from a wall calculated using only today's contracts. Both can be correct for their chosen horizon.
What a call wall measures
A call wall points to a notable call-side concentration in the modeled profile. Consider a stock trading below a strike with heavy call activity. If relevant dealers are long gamma and adjust hedges, their selling after a rise could lean against the move. If they are short gamma, their hedge adjustment could lean with it. The option chain alone does not identify which case applies.
This is why a call wall deserves observation rather than blind confidence. A rally can pause, pass through, or reverse before it gets there. Watch the behavior at the level: does price spend time above it, and does liquidity support the move? A one-tick crossing carries much less information than sustained trade beyond the strike.
What a put wall measures
The put wall is an analogous concentration on the put side. It often appears below spot, but the label is not a promise of support. A falling market can slow near a heavy put strike. It can also accelerate through one when a larger catalyst or thin liquidity dominates any stabilizing flow.
Imagine a modeled put wall at 500 and spot at 503. If price reaches 500 with small trades and stabilizes, you have an observation worth following. If it reaches 500 during a broad selloff and buyers disappear, the number on the screen has not changed the order book. The market's response is the evidence.
How the flip is different
The gamma flip marks an estimated transition in the profile, rather than another large strike. It can move as market conditions change. Treat it as an area to watch, not a precise boundary that every participant must respond to.
Traders sometimes describe the area on one side as a potentially dampening regime and the other as a potentially amplifying one. That language assumes the modeled sign resembles actual dealer risk. It also assumes enough delta hedging occurs to matter against other flows. Treat it as a conditional scenario.
A compact routine
- Check the timestamp, underlying, expiry window, and unit of the profile.
- Mark the nearest wall and the modeled flip as areas to observe.
- At a test, watch price acceptance, traded volume, and available liquidity.
- Recheck after a large move or volatility repricing, especially near expiry.
Sources and further reading
The research this guide leans on. Citations rather than links, so they stay verifiable after journal URLs move.
- Ni, S.X., Pearson, N.D. and Poteshman, A.M. (2005). Stock price clustering on option expiration dates. Journal of Financial Economics 78(1).
- Avellaneda, M. and Lipkin, M.D. (2003). A market-induced mechanism for stock pinning. Quantitative Finance 3(6).
- Ni, S.X., Pearson, N.D., Poteshman, A.M. and White, J. (2021). Does Option Trading Have a Pervasive Impact on Underlying Stock Prices? Review of Financial Studies 34(4).
- Cboe Global Markets (2025). 0DTEs Decoded: Positioning, Trends, and Market Impact.