
Reading volume footprints
Read traded volume at each price, including delta and imbalances, without over-reading one colored cell.
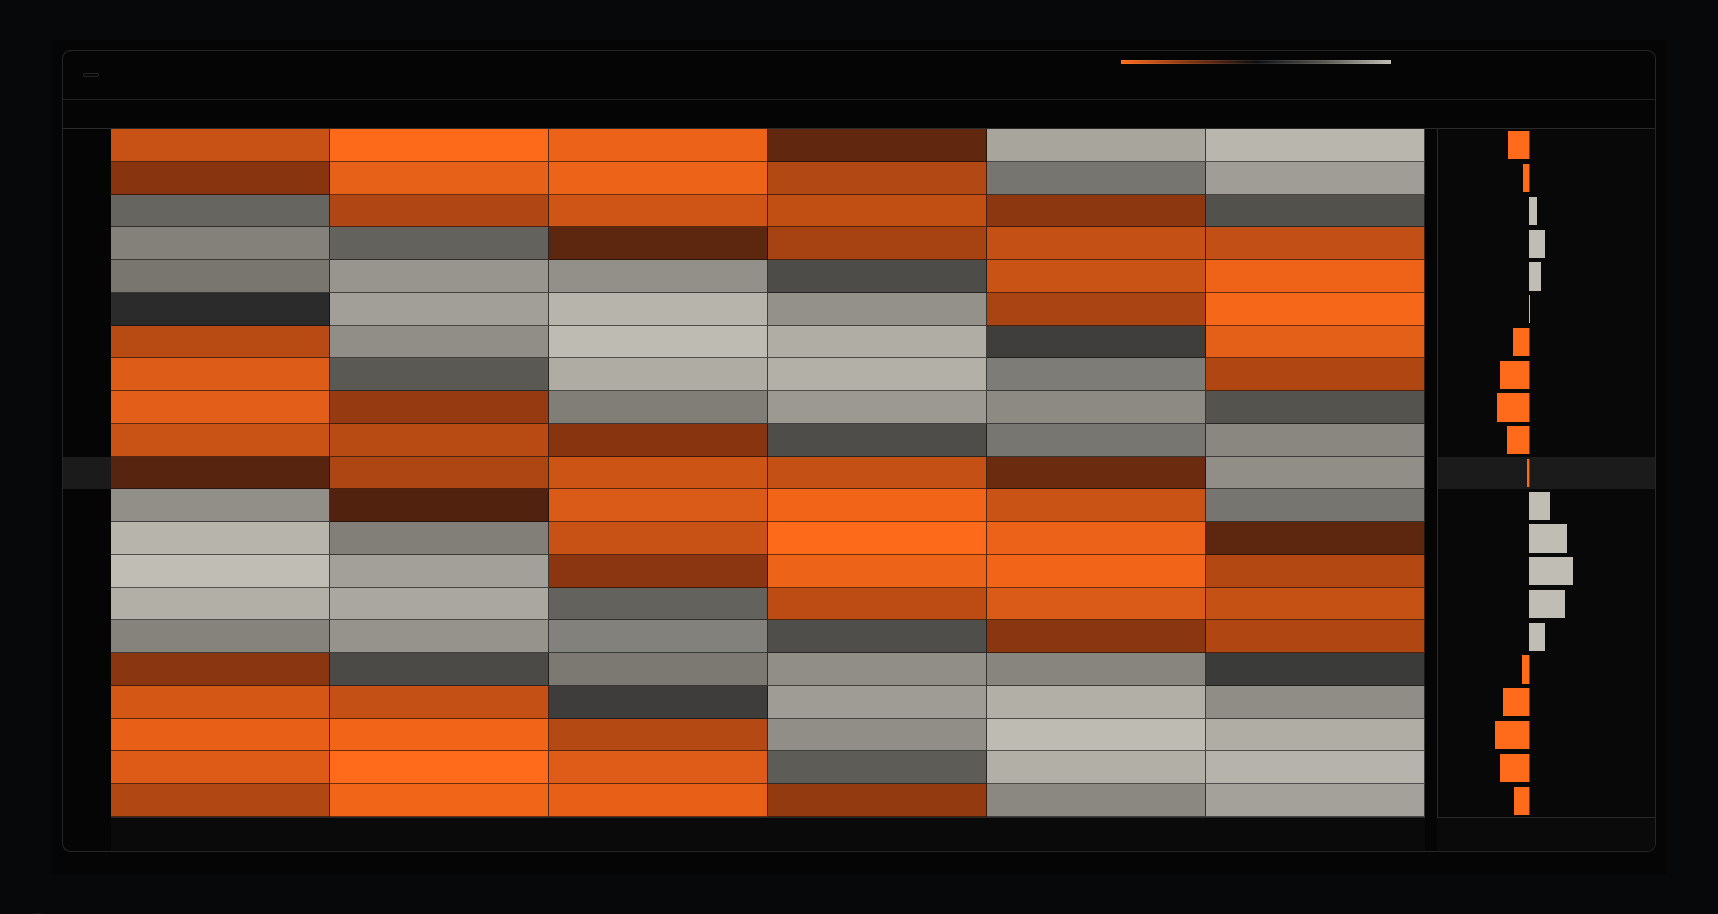
A candlestick shows the open, high, low, and close for a period. A footprint breaks that same period into price levels and shows how much traded at each one. It can help explain why a bar that looks strong on a simple chart stalled before the close.
Many footprint displays put volume traded at the bid on one side and volume traded at the offer on the other. A trade hitting the bid is classified as seller initiated; a trade lifting the offer is classified as buyer initiated. The classification depends on the data and method the platform uses, so the numbers are a view of executed activity rather than a complete record of every participant's intent.
Delta is a count of aggression
At each price, subtract bid-side volume from offer-side volume to get a local delta. Add those differences across a bar to get bar delta. A positive number means more volume was classified as aggressive buying. It does not say the buyers were right. Someone can keep buying at the offer while a patient seller provides enough supply to stop price from rising.
Picture a five-minute bar that closes near its open despite a large positive delta. The buyer-initiated trades happened, but the underlying price made little progress. That is worth investigating at a nearby level. It is not proof of an imminent reversal; the resting seller may stop supplying liquidity on the next push.
Imbalances need a definition
Some platforms highlight a ratio between buying at one price and selling at an adjacent price. Traders call a sequence of these highlights a stacked imbalance. The ratio, minimum volume, and comparison method are settings, not laws of the market. A three-to-one highlight in a thin contract can be less informative than a smaller ratio backed by substantial volume in a liquid one.
Read the highlighted prices with the bar's range and the surrounding bars. Were buyers able to lift price into a new area, or did they spend heavily without moving it? The second question often tells you more than the color on the footprint.
Highs and lows deserve a second look
Some traders mark an unfinished auction when substantial volume still traded at a bar's extreme. The idea is that the auction did not visibly taper before the period ended. Price may revisit the extreme, but it has no obligation to. The mark is a prompt to watch the next test, not a standing target.
Put the footprint beside context
A modeled gamma wall identifies a price worth monitoring under an option-chain assumption. A footprint shows what traded there. If aggressive sellers hit a put-wall area and price holds, you have two observations to investigate. If the level breaks and trade accelerates, the footprint is also telling you that the map did not hold that time.
Sources and further reading
The research this guide leans on. Citations rather than links, so they stay verifiable after journal URLs move.
- Lee, C.M.C. and Ready, M.J. (1991). Inferring Trade Direction from Intraday Data. Journal of Finance 46(2).
- Cont, R., Kukanov, A. and Stoikov, S. (2014). The Price Impact of Order Book Events. Journal of Financial Econometrics 12(1).
- Harris, L. (2003). Trading and Exchanges: Market Microstructure for Practitioners. Oxford University Press.