
Implied vs realized volatility
Compare option-implied volatility with recorded price movement using matching windows and clear units.
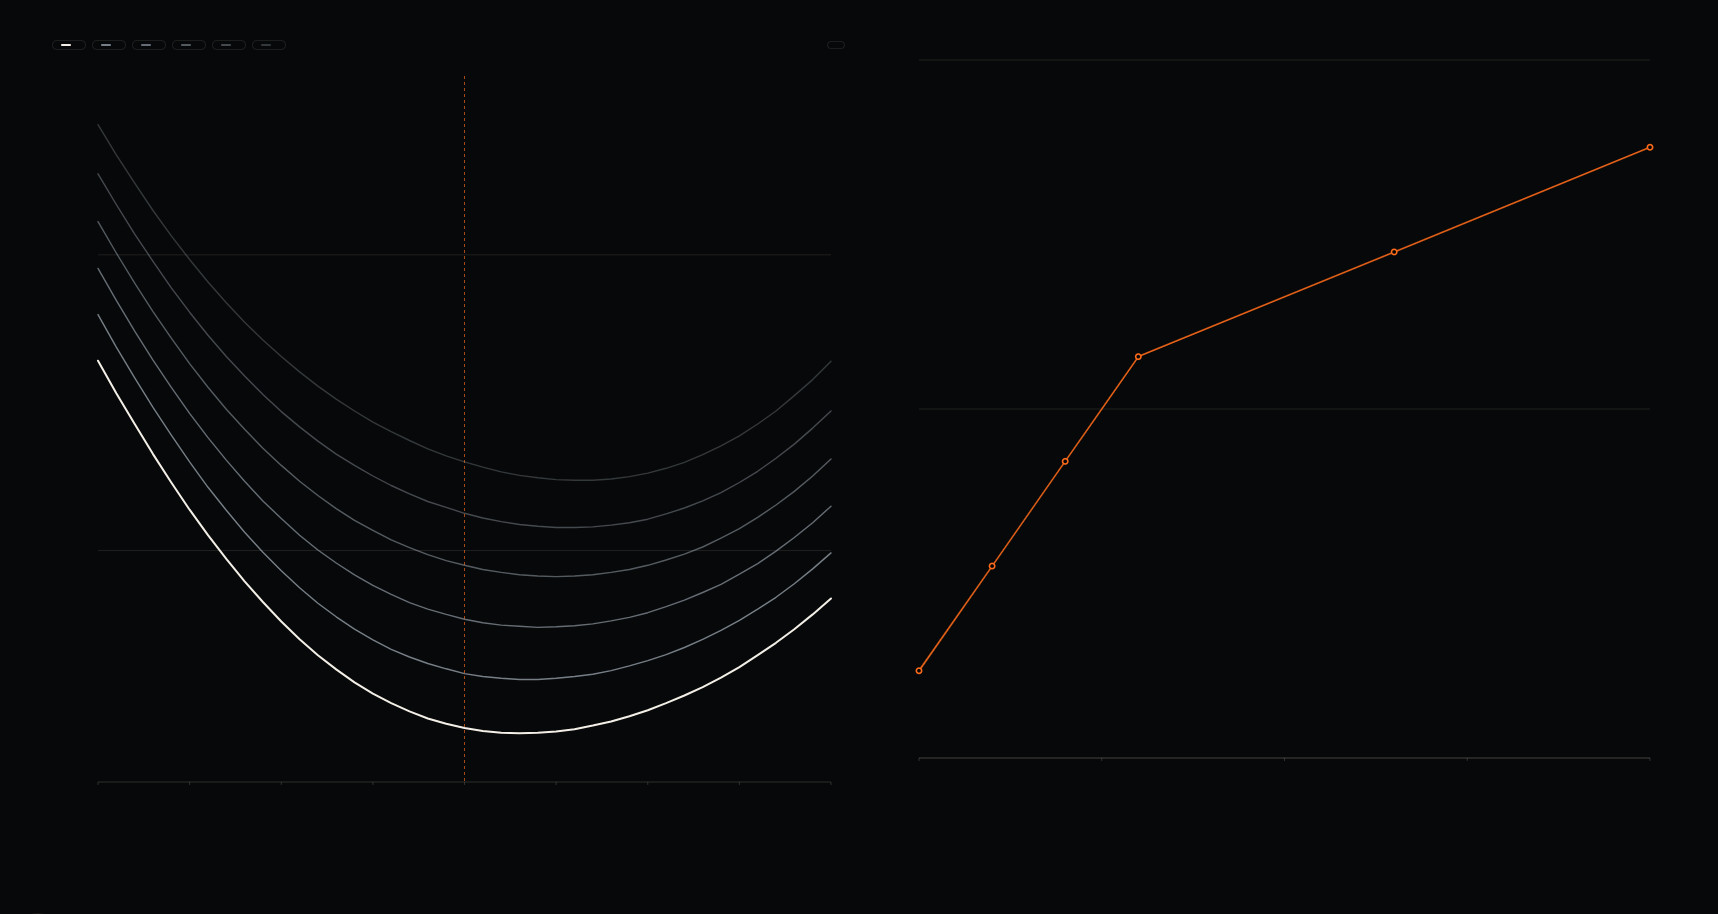
Implied volatility comes from option prices. Realized volatility comes from the underlying's recorded returns over a chosen past window. Both are commonly annualized, which makes them look directly comparable on a screen. The comparison is useful only when the horizon and method are clear.
What the option market is pricing
A pricing model can solve for the volatility input that makes its theoretical option value match a traded price. That input is implied volatility. It reflects the market price of uncertainty for that contract, including supply, demand, and known events. Different strikes and expiries can carry different implied volatilities, so a single “IV” number always summarizes part of a surface.
Implied volatility is often described as a forecast. It is better to remember that it is backed out of a price people are willing to trade. It does not promise a particular future path or direction. An event can make short-dated options expensive while longer-dated options move much less.
What the underlying already did
Realized volatility is calculated from past price changes. The answer depends on whether you use daily or intraday returns, how many observations you include, how you annualize them, and whether overnight gaps are part of the window. A five-day realized measure can jump after one large day even if the rest of the week was quiet.
Comparing 30-day implied volatility with yesterday's realized movement can be misleading. Match the period as closely as possible and note whether the option contains a known event. A scheduled earnings release can justify a high short-dated IV even when the preceding month was calm.
The gap is compensation for risk
Across many markets and periods, implied measures have often exceeded subsequent realized measures on average. The difference can compensate option sellers for bearing volatility and tail risk. It is not a free yield. One unusually large move can overwhelm many small premiums, and transaction costs or hedging choices change the realized outcome.
A useful reading asks two questions. How much movement is priced into the option for the period you care about? How much movement has the underlying recently delivered over a comparable period? If they differ, identify a reason before deciding the option is cheap or rich.
How the comparison meets GEX
A gamma profile can change as volatility reprices. Realized movement helps you assess what the market has actually done during the session. Neither number reveals net dealer inventory, so do not infer an automatic hedge flow from the gap alone.
Sources and further reading
The research this guide leans on. Citations rather than links, so they stay verifiable after journal URLs move.
- Bakshi, G. and Kapadia, N. (2003). Delta-Hedged Gains and the Negative Market Volatility Risk Premium. Review of Financial Studies 16(2).
- Carr, P. and Wu, L. (2009). Variance Risk Premiums. Review of Financial Studies 22(3).
- Andersen, T.G., Bollerslev, T., Diebold, F.X. and Labys, P. (2003). Modeling and Forecasting Realized Volatility. Econometrica 71(2).
- Parkinson, M. (1980). The Extreme Value Method for Estimating the Variance of the Rate of Return. Journal of Business 53(1).