
TPO and Market Profile fundamentals
Understand time at price, value area, point of control and single prints in a TPO profile.
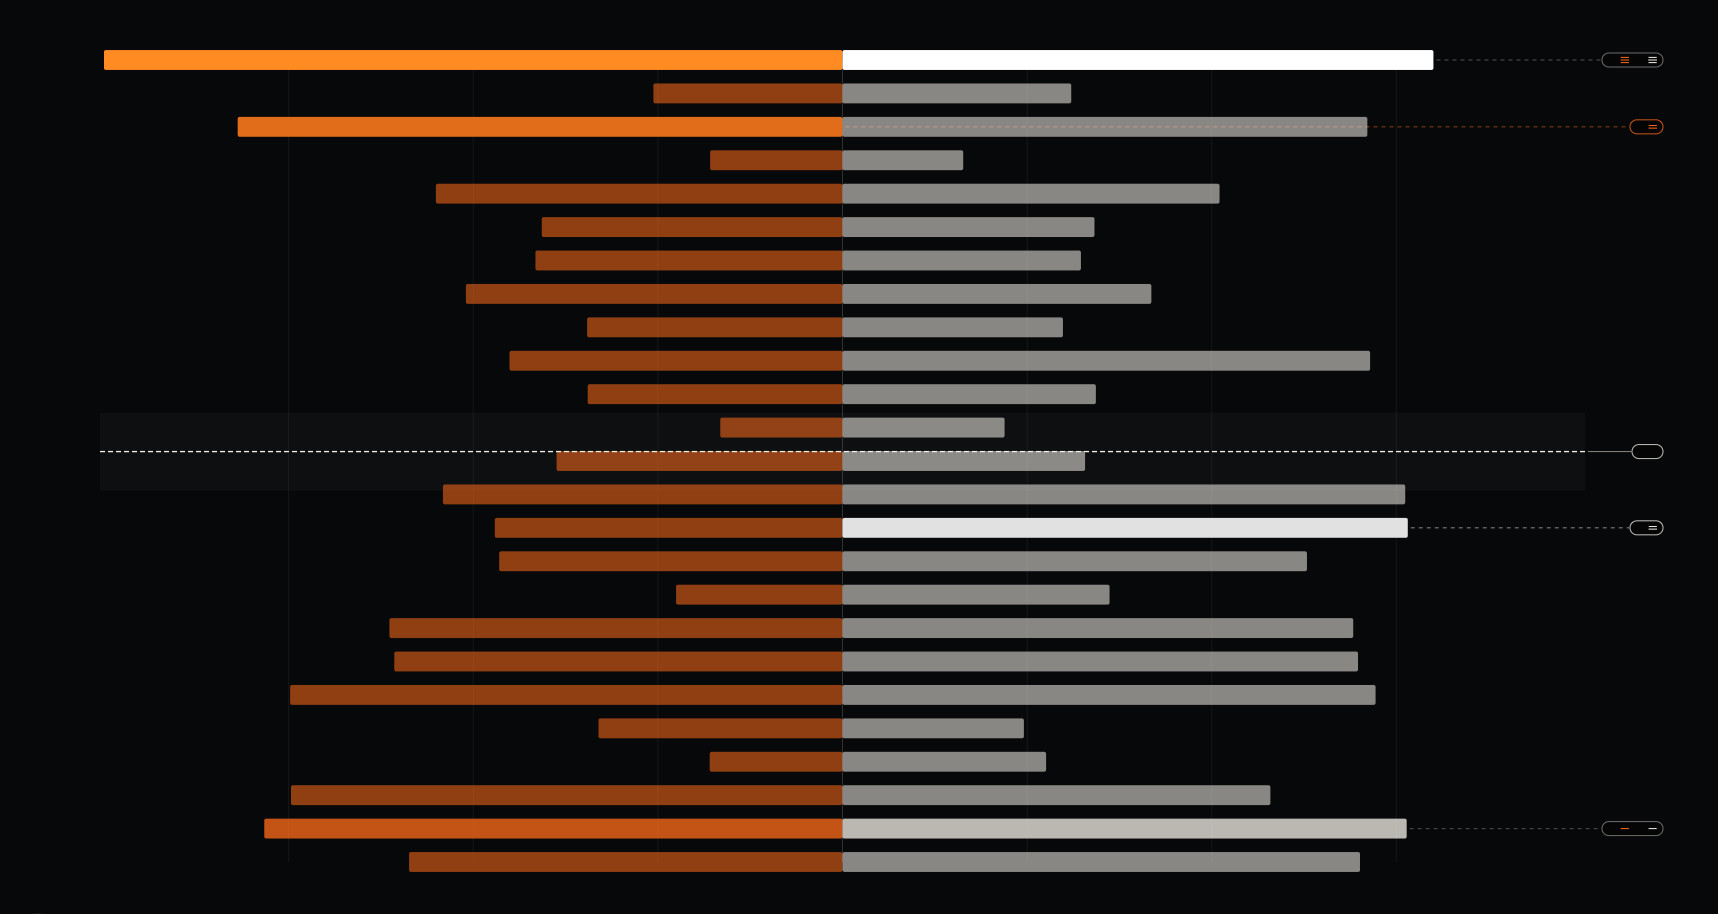
A time-price opportunity profile, usually called TPO, reorganizes a trading session by the prices it visited. Traditional profiles mark each time bracket with a letter. Stack those marks by price and you get a picture of where the market spent time. The picture can be useful, provided you remember it describes past acceptance rather than a price the market owes you tomorrow.
Time at price is not volume at price
A TPO profile counts time brackets that touched each price. A volume profile counts contracts or shares traded at each price. They may produce similar shapes, but a quiet half hour and a frantic half hour can contribute similarly to TPO while contributing very differently to volume. Check which one your platform displays before drawing conclusions from its shape.
Imagine a market trading around 100 for several hours, then crossing 103 briefly on a headline. The TPO profile will be broad around 100 and thin near 103. That tells you where time was spent and where price moved quickly. It does not identify whether the quick move was driven by aggressive buying, withdrawn offers, or both.
The point of control and value area
The point of control is the price with the most TPO marks under the chosen profile settings. The value area is a band containing a selected share of the profile, often about 70 percent, calculated by an expansion rule around the point of control. Different session hours, bracket lengths, and tie-breaking rules can change these levels. They are summaries of the chosen data window.
Many traders watch a return to the value area after price has traded away from it. A return can be meaningful if the market again spends time there. A brief touch is weaker evidence. The useful question is whether the current auction is accepting the old area or seeking a new one.
Single prints and tails
A single print is a price touched in only one time bracket within the profile. A run of them shows that the market moved through those prices without spending much time. It is tempting to call every such area unfinished and expect a revisit. Sometimes price returns; sometimes it continues away because new information changed value. The profile alone cannot choose between those outcomes.
Look at what happened after the quick move. Did price build a new cluster higher or lower, or did it immediately return to the earlier distribution? A new cluster suggests acceptance developing elsewhere. A return suggests the excursion did not last.
Pairing TPO with other evidence
A modeled gamma wall and a value-area edge can land near the same price. They arise from different data: one from option-chain assumptions, the other from time spent trading. That makes the area worth observing. It does not guarantee a stronger level. Let current trade and liquidity show whether the overlap matters today.
Sources and further reading
The research this guide leans on. Citations rather than links, so they stay verifiable after journal URLs move.
- Steidlmayer, J.P. and Koy, K. (1986). Markets and Market Logic. Porcupine Press.
- Dalton, J.F., Jones, E.T. and Dalton, R.B. (1990). Mind Over Markets. Traders Press.
- Chicago Board of Trade (1984). CBOT Market Profile. Exchange manual, original specification.